
Page 5 - vodafone
P. 5
Business Additional Vodafone Group Plc
Overview review Performance Governance Financials information 03 Annual Report 2013
More on:
Key performance
indicators
Pages 18 and 19
We have seen mixed trends in our business this year,
with a dificult macroeconomic environment and
regulatory pressure affecting many of our European
businesses, strong growth in emerging markets and
an excellent performance from our US associate.
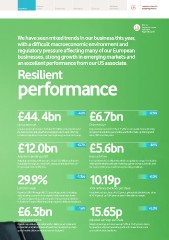
Resilient
performance
£44. 4bn -4.2% £6.7bn +7.5%
Group revenue Data revenue
Group revenue decreased -4.2% to £44.4 billion as strong demand Data revenue increased 7.5%, or 13.8% on an organic basis, relecting
*
for data services and growth in emerging markets were offset by increased smartphone penetration and further take-up of integrated
continued signiicant economic and regulatory pressures in Europe. voice, SMS and data plans.
£12.0bn +3.7% £5.6bn -8.1%
Adjusted operating proit Free cash low
Adjusted operating proit was up 3.7% at £12.0 billion, and above Free cash low of £5.6 billion was within our guidance range. The decline
our guidance range, as a result of a strong contribution from our relected the relative strength of sterling against several currencies over
US associate, Verizon Wireless. the course of the year, as well as tough trading conditions.
29.9% -1.3pp 10.19p +7.0%
EBITDA margin Total ordinary dividends per share
Reported EBITDA margin fell -1.3 percentage points. Excluding Final dividends per share of 6.92 pence, giving total dividends per share
restructuring costs and on an organic basis margin was down of 10.19 pence, up 7.0% year-on-year, in line with our target.
-0.1 percentage points, as the impact of steep revenue declines
*
in Southern Europe offset improving margins in India and Vodacom.
£6.3bn -1.6% 15.65p +5.0%
Capital expenditure Adjusted earnings per share
Capital expenditure was stable at £6.3 billion as we continued Adjusted earnings per share was up 5.0% at 15.65 pence, driven
to maintain a signiicant level of investment to extend our high by growth in adjusted operating proit and a lower share count
speed mobile data coverage across our footprint. as a result of share buybacks.