Quick Upload
Explore
Features
Support
Contact Us
FAQ
Help Document
Pricing
Sign In
Sign Up
Quick Upload
Explore
Features
Support
Contact Us
FAQ
Help Document
Pricing
Sign In
Sign Up
Guset User
Download PDF
Publications :
77
Followers :
0
Introduction to Bode Plot - University of Utah
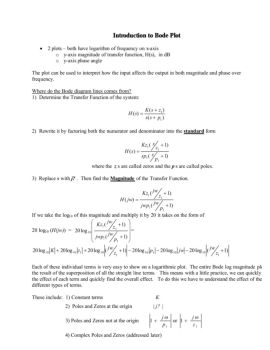
Introduction to Bode Plot • 2 plots – both have logarithm of frequency on x-axis o y-axis magnitude of transfer function, H(s), in dB o y-axis phase angle
View Text Version
Category :
0
0
Embed
Share
Upload
Related publications