Quick Upload
Explore
Features
Support
Contact Us
FAQ
Help Document
Pricing
Sign In
Sign Up
Quick Upload
Explore
Features
Support
Contact Us
FAQ
Help Document
Pricing
Sign In
Sign Up
Guset User
Download PDF
Publications :
61
Followers :
0
12.2 Graphs of Functions of Two Variables Visualizing a ...
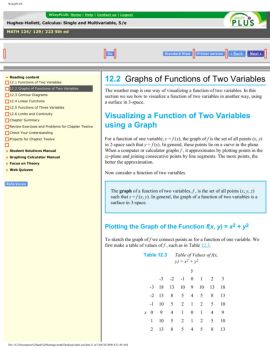
WileyPLUS Figure 12.15 Graph of h(x, y) = 5 - x2 - y2 (c) The graph of k(x, y) = x2 + (y - 1)2 = f (x, y - 1) is a paraboloid with vertex at x = 0, y = 1, since that ...
View Text Version
Category :
0
0
Embed
Share
Upload
Related publications